eCommerce UX in 2026: design that lifts conversion and ranking


About 70% of online shopping carts are abandoned. The Baymard Institute puts the average at 70.22% across 50 studies (updated September 22, 2025). Many of those shoppers were never going to buy, but a large share left because of things a design team controls: costs that appear too late, a forced account, a checkout that is too long or breaks. That makes eCommerce UX the rare kind of design work whose payoff you can measure in orders.
The same choices also decide how search engines and AI shopping assistants read your store, because they depend on fast pages and clean, structured product information. This is the checklist we use, ordered by how much revenue each item usually touches.
1. Show the full price early
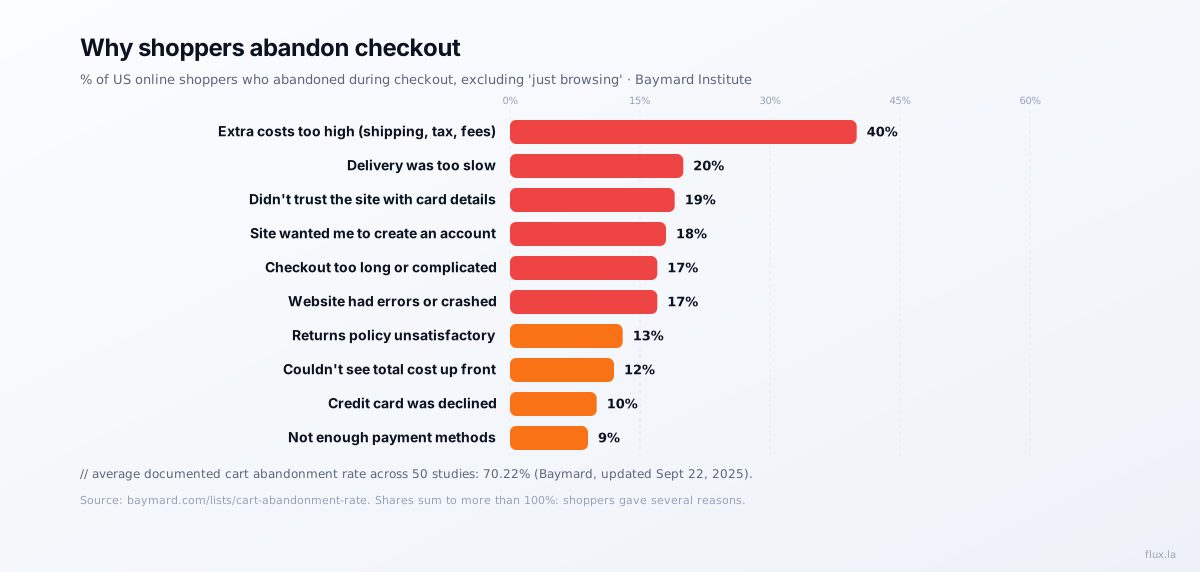
The single largest reason in Baymard’s data is extra costs that were too high: shipping, tax and fees, cited by 40% of US shoppers who abandoned a checkout (excluding people who were just browsing). Another 12% left because they couldn’t see or calculate the total cost up front.
Design fixes:
- Show shipping cost, or a free-shipping threshold, on the product page, not only at the last step.
- Add a shipping and tax estimator to the cart.
- If you charge fees, name them before the payment step.
2. Don’t force an account
18% abandoned because the site wanted them to create an account. Make guest checkout the default and offer account creation after the order is placed, when the only thing left to type is a password.
3. Shorten the checkout
17% said the checkout was too long or complicated. Count the form fields between cart and confirmation and remove every one you do not need to fulfil the order. Combine first and last name, use address autocomplete, default the billing address to the shipping address, and keep the number of steps visible.
4. Earn trust at the payment step
19% didn’t trust the site with their card details. Show recognised payment options and security cues next to the card form, not only in the footer. Offering wallets and alternatives helps here too: 9% left because there weren’t enough payment methods, and 10% because a card was declined, which a second option can rescue.
5. Make it fast, and keep it from breaking
17% left because the website had errors or crashed. Treat checkout reliability as a release gate: monitor errors on every checkout step, not just page uptime.
Speed is the other half. Google’s Core Web Vitals thresholds are an LCP within 2.5 seconds, an INP of 200 ms or less and a CLS of 0.1 or less, measured at the 75th percentile on real devices. Even sophisticated companies miss them: in our CrUX study of the Forbes Cloud 100, only 23 of 100 sites passed all three on mobile, and most failures were INP, the responsiveness metric that suffers when third-party scripts compete with taps on “Add to cart.” Our Core Web Vitals guide covers the fixes.
6. Set delivery and returns expectations
20% abandoned because delivery was too slow and 13% over the returns policy. Show delivery dates (“arrives by Thursday”) rather than shipping speeds, and summarise the returns policy in one line next to the buy button with a link to the details.
7. Give machines the same facts you give people
Search engines and AI shopping assistants decide what to show from the information they can read reliably. For Google, that means product structured data. Its merchant listing documentation separates required from recommended properties:
| Property | Status for merchant listings | Why it matters to a shopper |
|---|---|---|
name | Required | The product they searched for |
image | Required | What it looks like |
offers.price, priceCurrency | Required | The cost, the top abandonment reason |
availability | Recommended | Whether they can get it |
shippingDetails | Recommended | Delivery cost and speed, two of the top reasons above |
hasMerchantReturnPolicy | Recommended | The returns question, before they ask it |
aggregateRating | Recommended | Social proof |
brand.name, gtin | Recommended | Lets engines match your product across the web |
color, size, material | Recommended | Answers “blue, medium, cotton” style queries |
Notice the overlap: the properties Google recommends are the same facts whose absence makes people abandon. Mark them up and show them on the page; Google requires the two to match.
Write product descriptions the same way: lead with what the product is and who it is for, add a specification table, and answer the obvious objections (sizing, compatibility, care). That is what a human skims for and what an AI assistant can quote. Our guide to landing pages in the AI search era applies the same idea to lead-generation pages.
8. Build category pages that can rank
Category pages compete for commercial queries like “linen duvet cover” or “leather laptop bag,” and most stores leave them as a bare product grid. Add a short introduction that helps someone choose, link to the category from related products and guides, and mark up breadcrumbs. Our internal linking guide explains how to route authority to them.
How to measure progress
Track checkout as a funnel, step by step: cart to checkout start, each checkout step, and payment success. Pair it with field Core Web Vitals for your product and checkout templates, and with Search Console clicks to category and product pages. If you change something, give it enough traffic to judge; our A/B test sample size calculator tells you how much that is before you start, and our conversion rate optimization playbook covers what to test first.
Want a second pair of eyes on your store? Tell us about it.
FAQ
What is the average cart abandonment rate? 70.22%, according to Baymard Institute’s average of 50 studies, last updated September 22, 2025.
Why do shoppers abandon their carts? In Baymard’s survey of US shoppers (excluding those just browsing), the top reasons were extra costs that were too high (40%), slow delivery (20%), not trusting the site with card details (19%), being required to create an account (18%), and a checkout that was too long or complicated (17%).
What structured data does an online store need? For Google’s merchant listings, Product markup requires a name, an image and an offer with price and currency. Recommended properties include availability, shipping details, return policy, aggregate rating, brand and GTIN.
Related reading:
Sources: Baymard Institute, cart abandonment rate statistics; Google, merchant listing structured data; web.dev, Web Vitals.
One copyable AI agent, every Wednesday.
Flux founder Alejandro Rioja's weekly newsletter for operators: an agent he shipped that week, one growth experiment with real numbers, and what's working across SEO and GEO right now.
Free · 1-click unsubscribe · confirm by email and you're in.
Alejandro Rioja
Operator who builds and sells marketing-focused brands. Founder of Pickleland, founder of Flux.LA, writing about AI SEO + GEO at alejandrorioja.com.