A/B testing in 2026: when it works, when it fails

Most marketing A/B testing advice assumes you have Netflix-scale traffic. You don’t. A typical B2B site gets 2,000-10,000 monthly visitors. A typical D2C brand gets 30,000-100,000. At those volumes, almost no test you run will reach statistical significance in a reasonable window — and pretending otherwise wastes months.
This is the honest framework we use across our portfolio. It’s less about p-values and more about deciding which tests are worth running at all — and it holds regardless of which testing platform or AI-assisted tool you’re running in 2026.
The 2026 numbers most teams overestimate
Case-study culture has warped expectations. Before you build a testing roadmap, calibrate against what actually happens industry-wide:
- Most tests don’t reach real significance. An audit of 2,288 A/B tests by ConversionTeam found 50.5% produced a raw winner, but only 19.1% reached statistical significance per test — the rest were noise, whichever direction they leaned. Strip out the inconclusive middle and the decisive win rate (wins ÷ wins-plus-losses) lands at 63.7%. If your roadmap assumes most tests will show a clean, significant winner, it’s wrong.
- Winning lifts are modest, not dramatic. DRIP Agency’s dataset of experiments across 91 e-commerce brands puts the win rate at 36.3% with a median revenue-per-visitor uplift of just +2.77% for winning variants — a long way from the 30–50% swings that circulate in conference talks. Those headline numbers come from the long tail: a small share of outsized wins pulling the average up.
- Adoption is uneven. Fewer than one in five marketers test landing pages consistently, even though teams that run ten or more test variations report meaningfully better outcomes than teams running one-off tests. Testing cadence, not any single test, is what compounds.
- AI-assisted platforms shorten the wait. Teams running AI-driven experimentation tools are reaching valid results roughly a third faster than teams on traditional split-testing tools — useful context if your sample-size math (below) is putting a test out of reach on a manual timeline.
- Test type still drives win rate more than tooling does. That same 91-brand dataset found basket-page and pricing-page tests winning more often than cosmetic homepage tests, with server-side tests slightly outperforming client-side ones. That maps directly onto the priority order below — pricing and funnel-adjacent pages first, homepage cosmetics last.
- Maturity is rising, but the fundamentals lag behind it. Speero’s 2025 Experimentation Maturity Program Report found 54% of companies now sit at a “strategic” or “transformative” maturity stage, up from 35% in 2021 — real progress. But in the same survey, 52% still have no formal pre-launch QA process and 58% have no clear prioritization framework. That’s the gap this post keeps coming back to: teams are running more tests without first fixing the two things (QA, prioritization) that determine whether those tests are worth running at all.
None of this means testing doesn’t work. It means the honest baseline is “most tests are inconclusive and the ones that win move the needle a little” — which changes what’s worth testing at all, covered next.
Test only when the delta could be material
The first filter: would a 20% improvement in this metric actually matter to the business? If the answer is no, don’t test.
Examples of tests that meet this bar:
- Homepage hero CTA copy (drives top-of-funnel conversion)
- Pricing page layout (drives mid-funnel conversion)
- Onboarding flow first step (drives activation)
- Email subject line on a campaign with 50K+ recipients
Examples that almost never meet this bar:
- Button color
- Whitespace adjustments
- Header font weight
- Footer link order
The button-color tests became internet famous because Google ran them at scale. At your scale, even a real 20% lift would take 6 months to detect with confidence, by which point the underlying market has changed.
Sample size math, in plain English
To detect a 10% relative lift on a 5% baseline conversion rate at 80% statistical power, you need roughly 30,000 visitors per variant. 60,000 total. If your site gets 5,000 monthly visitors total, that’s a year-long test.
The rule of thumb that’s served us across 11 brands: if you can’t ship the test result in 6 weeks at a 95% confidence band, you don’t have enough traffic to test that hypothesis. Make a decision instead.
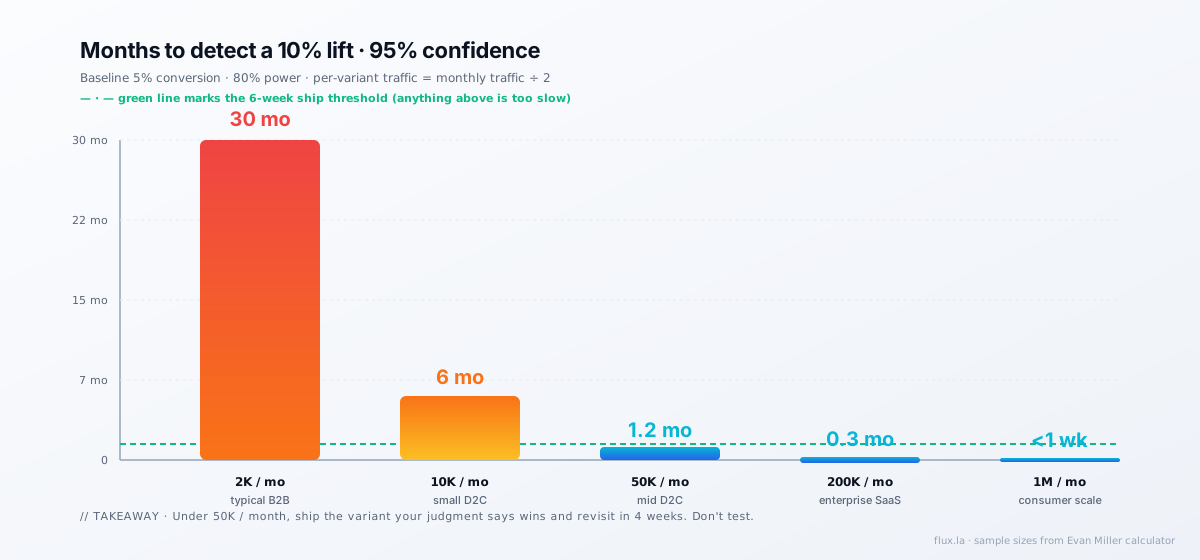
Use Evan Miller’s calculator to sanity-check sample size before starting. Most teams skip this and learn 8 weeks in that they were never going to reach significance.
What to do when you can’t test
This is the most under-discussed reality of small-team A/B testing: most decisions should be made via judgment, not stats.
Three frameworks we use when we can’t reach significance:
Look at the qualitative signal first. Run session recordings (we use Microsoft Clarity, which is free). If the variant fixes a problem you can SEE — users hesitating, scrolling past the CTA, abandoning a form — that’s a stronger signal than a 60%-confidence quant result. And if what you see is a page that loads slowly or shifts as it renders, don’t test around it: that’s a fix, and a technical SEO audit is the faster way to find it.
Use external benchmarks. If your homepage conversion is 1.2% and similar B2B SaaS sites benchmark at 2.5%, you have headroom regardless of which variant tests “better” on your tiny sample.
Make a reversible decision and revisit. Ship the variant your judgment says wins. Watch the topline metric for 4 weeks. If it doesn’t get worse, keep it. If it does, revert. This is faster than testing for most small teams.
What to actually test
When you DO have the traffic and the delta would be material, here’s the priority order we use:
- Pricing page. Highest leverage. A 10% lift here moves topline revenue more than any other test.
- Top-of-funnel CTA copy and placement. A bigger top-of-funnel lifts every subsequent metric.
- Onboarding step 1. Activation drops here are catastrophic — fix this before testing anything downstream.
- Email subject lines (on lists over 50K). Highest-velocity test you can run.
- Paid ad creative. If you’re spending over $10K/mo on paid, creative tests pay for themselves fast.
Things we explicitly de-prioritize:
- Color tests
- Single-word copy swaps
- Anything below 1,000 weekly conversions
When to bring in an A/B testing agency vs. run it in-house
Most small and mid-size teams can run everything above themselves — the tooling is cheap and the discipline (test only high-leverage surfaces, run the sample-size math, sequence one test at a time) is learnable. Where an outside team earns its keep isn’t running the test itself; it’s the three things teams consistently get wrong without a second set of eyes:
- Prioritization. Deciding what’s worth testing at all, before any code gets written, so you’re not six weeks into a test that was never going to move a business metric.
- Reading ambiguous results correctly. Telling the difference between “inconclusive because the sample was too small” and “inconclusive because there’s genuinely no effect” — teams without testing experience routinely treat these as the same thing and either ship noise or give up on a real signal too early.
- Catching the parallel-test collision problem. The single most expensive mistake in this post (below) is invisible until someone who’s seen it before points it out.
If you’re weighing an agency, ask what they’ll do differently from a good in-house analyst: the honest answer should be about judgment on the three points above, not “we have a tool you don’t.” That’s the audit work we do for clients before any test gets built — see conversion rate optimization for how it fits into the broader CRO program. If you’re already sold on hiring out and want the pricing bands and red flags for evaluating a shop, see A/B testing and CRO agencies in 2026.
A data point worth knowing if you’re comparing agencies: Convert’s 2025 Experimentation Agency Report identified 237 experimentation agencies, and found 76% say AI is now a core part of their workflow — but also that nearly a third run 10 or fewer experiments a month. Test volume alone isn’t a quality signal in either direction, but it’s a fair question to ask a shop you’re evaluating.
Tool choice in 2026
The landscape shifted this year: VWO and AB Tasty merged under the Wingify brand, and the combined pricing page no longer publishes self-serve rates — everything is now a demo/quote, which is a step back from the transparent pricing VWO used to lead with. Budget accordingly if you’re used to self-serve signup.
| Tool | Best for | Pricing (2026) |
|---|---|---|
| PostHog | Early-stage teams already using it for analytics | Experiments bundled into Feature Flags: 1M requests/mo free, then $0.0001/request |
| GrowthBook | Small teams that want a free, open-source option with no usage cap | Free Starter (3 users, 1 project, unlimited flags/experiments/traffic); Pro $40/seat/mo adds the AI visual editor and multi-armed bandits |
| Statsig | Teams that want generous free-tier volume | Free up to 2M events/mo; Pro from $150/mo |
| VWO / AB Tasty (now Wingify) | D2C teams that want a visual editor and don’t mind a sales call | Custom quote only — no published self-serve price as of 2026 |
| Optimizely | Enterprise, multi-brand programs | Custom enterprise pricing, typically a 5-figure annual commitment |
| LaunchDarkly | Teams that already run feature flags and want experimentation on top | Feature-flagging platform first; experimentation is a strong secondary use case |
None of this changes the core argument above: the tool you pick matters far less than whether you have the traffic to reach significance and the discipline to test one thing at a time.
How to read results when you don’t have significance
You’ll often hit a 90% confidence interval after 3-4 weeks but never close the last 10%. Two options:
Ship the leading variant if the cost of being wrong is low. A change to a homepage CTA that’s marginally better than the control is fine to ship at 80% confidence. You can revert.
Don’t ship if the cost of being wrong is high. A pricing page change at 80% confidence isn’t safe. Either run longer or change the test design.
The single most expensive A/B testing mistake
Running too many tests in parallel on the same audience. If you’re testing the homepage hero AND the pricing page AND the email subject line on the same week, the variants interact and you can’t attribute the lift to any one change. We’ve seen teams burn 3 months chasing a result that turned out to be one of three concurrent tests they didn’t realize were colliding.
Sequence, don’t parallelize. One major test at a time.
What we run for clients
For the clients we work with, we typically run 2-3 tests per quarter on the highest-leverage surfaces. Quality of judgment matters more than test volume.
If you want help figuring out which tests are worth running on your funnel — or whether you should be testing at all — tell us what you’re working on.
FAQ
What’s a realistic A/B testing strategy for marketing in 2026? Stop testing everything and start testing only where the delta could be material: pricing pages, top-of-funnel CTAs, onboarding’s first step, and email subject lines on large lists. Run the sample-size math before you start — most sites under 50,000 monthly visitors can’t reach significance on a homepage color change in any reasonable window. Sequence one major test at a time instead of running several in parallel on the same audience, and treat “no significant result” as a normal outcome, not a failed test.
How do you A/B test marketing campaigns when traffic is limited? Use the qualitative signal first — session recordings that show users hesitating or abandoning are a stronger read than a 60%-confidence quant result. Benchmark against industry conversion rates to find headroom regardless of which variant “wins” on a small sample. And when you genuinely can’t reach significance, ship the variant your judgment favors, watch the topline metric for four weeks, and revert if it gets worse. That reversible-decision approach is often faster than testing for small-traffic teams.
Do I need an A/B testing agency, or can a small team run this in-house? Most small and mid-size teams can run this in-house with a free or low-cost tool (PostHog, VWO) and the discipline to only test high-leverage surfaces. Where an outside team adds value is prioritization — deciding what’s worth testing at all, reading inconclusive results correctly, and avoiding the parallel-test collision problem that quietly wastes a quarter. That’s the audit work we do for clients before any test gets built.
What conversion lift should I expect from A/B testing? Calibrate low. Industry data puts the median winning lift around 6%, not the 30-50% swings featured in case studies — those come from a small long tail of outsized wins. A well-run testing program compounds through cadence (regularly testing high-leverage surfaces) more than through any single test producing a dramatic result.
Related reading on this site:
- Conversion rate optimization in 2026 — the full CRO operating system this post’s experiment mechanics slot into
- A/B testing and CRO agencies in 2026 — pricing bands and red flags if you’re evaluating outside help
- How SEO actually works in 2026 — the strategic frame that A/B tests sit inside
- Top 8 content marketing campaigns from 2024-2026 — examples that won without testing
One copyable AI agent, every Wednesday.
Flux founder Alejandro Rioja's weekly newsletter for operators: an agent he shipped that week, one growth experiment with real numbers, and what's working across SEO and GEO right now.
Free · 1-click unsubscribe · confirm by email and you're in.
Alejandro Rioja
Operator who builds and sells marketing-focused brands. Founder of Pickleland, founder of Flux.LA, writing about AI SEO + GEO at alejandrorioja.com.