Only 23 of the Forbes Cloud 100 pass Core Web Vitals on mobile (2026 data)


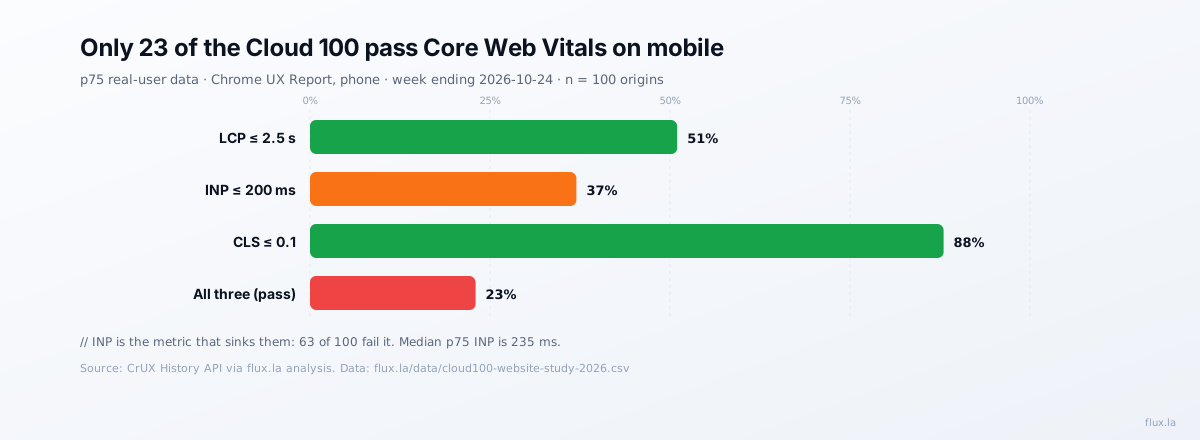
What share of top websites pass Core Web Vitals? For the most valuable private software companies in the world, less than a quarter. We pulled Chrome UX Report (CrUX) data for all 100 companies on the 2025 Forbes Cloud 100 and checked each origin against Google’s three thresholds on phones. 23 of 100 pass all three. The metric doing the damage is not loading speed but responsiveness: 63 of the 100 fail Interaction to Next Paint (INP).
These are companies with large engineering teams, modern frameworks and real budgets. If their sites miss, yours probably needs checking too. Every number below is real-user data from Chrome, for the collection week ending October 24, 2026. The per-site results are in our CSV.
Key findings
- 23% of Cloud 100 origins pass all three Core Web Vitals on mobile at the 75th percentile.
- INP is the bottleneck: only 37 have a good INP (≤200 ms). 57 are “needs improvement” and 6 are “poor” (above 500 ms).
- LCP is a coin flip: 51 have a good Largest Contentful Paint (≤2.5 s); 15 are poor (above 4 s).
- CLS is mostly solved: 88 have a good Cumulative Layout Shift (≤0.1).
- 21 sites fail on INP alone. Fix responsiveness and the pass rate would nearly double, from 23 to 44.
- Medians: p75 LCP 2.48 s, p75 INP 235 ms, p75 CLS 0.02. The median company is right on the LCP line and over the INP line.
The thresholds, so we are measuring the same thing
Google’s Web Vitals guidance defines “good” as: LCP within 2.5 seconds, INP of 200 milliseconds or less, and CLS of 0.1 or less, each measured at “the 75th percentile of page loads, segmented across mobile and desktop devices.” A site passes only if all three are good. INP replaced First Input Delay as the responsiveness metric in March 2024, and it is a much harder test: it scores the slowest interactions across the whole visit rather than only the first tap.
| Metric | Good | Needs improvement | Poor | Cloud 100 good | Cloud 100 poor |
|---|---|---|---|---|---|
| LCP | ≤ 2.5 s | 2.5–4 s | > 4 s | 51 | 15 |
| INP | ≤ 200 ms | 200–500 ms | > 500 ms | 37 | 6 |
| CLS | ≤ 0.1 | 0.1–0.25 | > 0.25 | 88 | 4 |
Who passes, and who struggles
The 23 that pass span every category on the list: Anthropic, Stripe, Navan, Grafana Labs, Gusto, Flock Safety, AlphaSense, Carta, Zoho, Cribl, 1Password, Lambda, Snyk, Collibra, Komodo Health, Automattic, Hugging Face, Runway, Fireworks AI, LaunchDarkly, Sierra, GlossGenius and EvenUp. The fastest were Automattic (LCP 1.07 s, INP 95 ms) and Anthropic (INP 97 ms).
At the other end, four sites fail all three metrics: Postman, Gong, Axonius and Algolia. The slowest single readings were:
| Worst p75 LCP | ms | Worst p75 INP | ms | Worst p75 CLS | score |
|---|---|---|---|---|---|
| webflow.com | 8,831 | elevenlabs.io | 739 | benchling.com | 0.35 |
| postman.com | 7,093 | clickup.com | 665 | axonius.com | 0.35 |
| perplexity.ai | 6,414 | workato.com | 550 | chainguard.dev | 0.33 |
| calendly.com | 5,800 | perplexity.ai | 533 | brex.com | 0.30 |
An important caveat on those names. CrUX scores an origin on every page Chrome users load there, and Google’s CrUX methodology says experiences “on all of that origin’s pages are aggregated at the origin-level.” Several of the slowest origins serve their logged-in product on the same domain as their marketing site (Webflow’s designer, Perplexity’s search app, Calendly’s booking pages), so their score blends a heavy application with the brochure. That is not an excuse, though: Google’s page-experience signals work from the same field data, so the blended number is the one search sees.
Why INP is where everyone fails
LCP is a loading problem, and the industry has spent five years on loading: CDNs, image formats, server rendering. INP measures what happens after the page loads, when a visitor opens a menu, types in a form or clicks a tab. Every analytics tag, chat widget, A/B-testing script and consent manager competes for the main thread at exactly that moment. A marketing site with six third-party scripts can load in two seconds and still freeze for 300 ms when someone taps “Pricing.”
That pattern matches what we see in audits. The fixes that move INP most, in our experience:
- Delay non-essential third parties (chat, heatmaps, social pixels) until after the first interaction or until the browser is idle.
- Break up long tasks in your own JavaScript so input handlers are never queued behind a 200 ms task.
- Remove client-side A/B-testing flicker scripts in favor of server-side or edge experiments.
- Audit tag managers. One forgotten container firing a dozen tags on every click is a common culprit.
Our Core Web Vitals guide covers each metric’s fixes in detail, and our technical SEO audit includes a field-data review like this one for your own origin and your top competitors.
Does it matter for rankings?
Google’s Core Web Vitals documentation says good scores, “along with other page experience aspects,” align with “what our core ranking systems seek to reward.” That is a long way from a dominant ranking factor; a relevant, slow page still beats a fast, irrelevant one. The more practical reason to care is conversion: a pricing page that hesitates on every tap loses buyers whether or not it loses rankings. If you run experiments, slow interactions also add noise to every test you run, which is one reason we recommend server-side testing in our A/B testing guide.
Methodology
- Sample. All 100 companies on the 2025 Forbes Cloud 100. For each we used the final origin the company’s homepage redirects to (for example
https://www.deel.com). - Data. Chrome UX Report History API,
PHONEform factor, p75 values for LCP, INP and CLS, latest weekly collection period ending 2026-10-24 (one origin, Odoo, had its latest period ending 2026-10-10). - Pass rule. An origin passes if p75 LCP ≤ 2,500 ms, p75 INP ≤ 200 ms and p75 CLS ≤ 0.1, following web.dev.
- Coverage. All 100 origins had CrUX data, so no company was excluded.
- Limits. Origin-level data blends marketing and product pages where they share a domain. Desktop results, which are usually better, are not included.
FAQ
What percentage of websites pass Core Web Vitals? Among the 2025 Forbes Cloud 100, 23% passed all three Core Web Vitals on mobile in October 2026 CrUX data. The pass rate across the wider web varies by month and device; check the HTTP Archive’s Core Web Vitals Technology Report for the latest all-web figure.
Which Core Web Vital do most sites fail? Interaction to Next Paint. In our study 63 of 100 Cloud 100 origins had a p75 INP above 200 ms on phones, compared with 49 failing LCP and 12 failing CLS.
What is a good INP score? 200 milliseconds or less at the 75th percentile. Between 200 and 500 ms “needs improvement,” and above 500 ms is “poor.”
Does Core Web Vitals data include logged-in app pages? Origin-level CrUX data aggregates real-user experiences across the origin’s pages, so if your product runs on the same domain as your marketing site, its performance counts toward the same score.
Related reading:
- Core Web Vitals in 2026: what each metric measures and how to fix it
- What structured data the Cloud 100 use: another technical benchmark from the same 100 sites
- Conversion rate optimization: why slow interactions cost leads
Sources: Chrome UX Report methodology; web.dev, Web Vitals; Forbes Cloud 100 (2025). Dataset: cloud100-website-study-2026.csv.
One copyable AI agent, every Wednesday.
Flux founder Alejandro Rioja's weekly newsletter for operators: an agent he shipped that week, one growth experiment with real numbers, and what's working across SEO and GEO right now.
Free · 1-click unsubscribe · confirm by email and you're in.
Alejandro Rioja
Operator who builds and sells marketing-focused brands. Founder of Pickleland, founder of Flux.LA, writing about AI SEO + GEO at alejandrorioja.com.